Building a Pull Request bot with Azure Functions - Part 3 - Operating it
- 10 minutes read - 1963 wordsThis is the third post in my series on building a pull request bot using Azure Functions. If you haven’t read my previous posts I strongly recommend doing so before diving into this post. Remember that this series is a part of the Applied Cloud Stories initiative.
In this post I want to give you a feel for how we operate our pull request on a daily basis. How do we deploy it, how do we make sure it is running, etc.
CI/CD
Of course we are applying continuous integration and continuous deployment practices to the bot, just like we do for our product. And of course we use Azure Pipelines to do it. For our build pipeline we don’t have anything fancy really. Azure Functions v2 runs on .NET Core, so we have a pipeline that runs dotnet restore, dotnet build, dotnet test and dotnet publish in that order. For the publish step we target the actual Azure Functions project so that we get a nice ZIP file containing everything we need to run. Finally we have two steps that upload artifacts to Azure DevOps, one that uploads the ZIP and one that upload the Azure Resource Manager (ARM) template (more on that later).
At the moment the pipeline is defined using the visual pipeline editor. I guess that’s fine for such a simple pipeline, but we have been experimenting with YAML pipelines for parts of our product so we might switch to that at some point. But that’s a topic in and of itself so I’ll save that for a future post.
For our deployment we’re using Release definitions in Azure Pipelines. We have created two stages here. The first stage deploys the infrastructure we need to run on using the ARM template I mentioned earlier. It’s really just one Azure Resource Group Deployment step that takes the ARM template and applies it to a resource group in Azure. The nice thing about this is that its idempotent. If you deploy the same template over and over the infrastructure will just stay the same. If you do make a change only that change is applied and the rest stays the same.
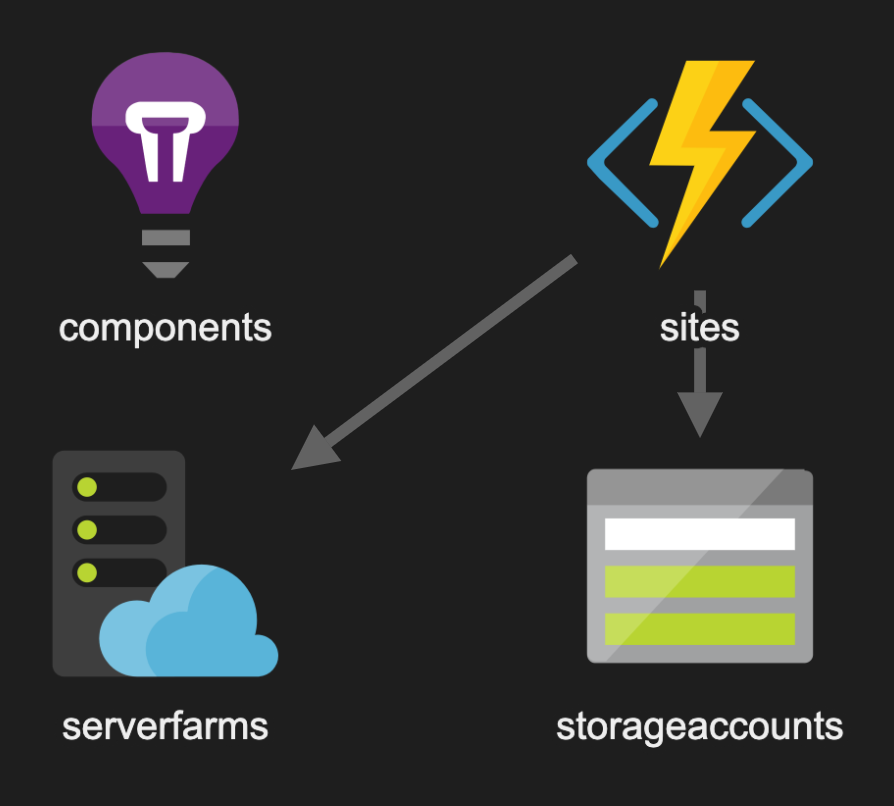
As for the contents of the ARM template, I’ve made a graphical representation of it using the excellent ARM Template Viewer extension for Visual Studio Code:

ARM Template
It’s not very complicated really. We have an Azure Function App (top right) that uses a Storage Account (bottom right) to store the state and an App Service Plan (bottom left) that provides the necessary infrastructure to run our Function app. At the moment we’re using the Consumption Plan so that we only really pay for what we use. Finally there’s the Application Insights resource (top left) that gives us the power to monitor the bot and look at logs etc. More on that later.
As a side note, I currently do not have visibility into the costs we’re making for this bot. This is because we have CSP (Cloud Solution Provider) subscription for which Azure Cost Management has only recently became available. Unfortunately that requires some migration work that’s currently ongoing. So far it barely registers on our overall Azure bill though.
After we’ve deployed our infrastructure we can deploy the application itself. This is done using a Azure App Service deploy step that simply uploads the ZIP we’ve built in our build pipeline to Azure. With that deployment we also pass in some configuration variables, such as the URL to our Azure DevOps organization, a personal access token and the subscription identifiers of the service hooks we’ve created in Azure DevOps for authentication purposes (see my second post in this series). Most of the variables are defined as secret variables on the release pipeline.
To make sure that we leave the bot in a working state after deployment we’ve also added a deployment gate on the last stage of the pipeline. This calls into a Health Check API we’ve implemented in the bot itself, which is just an HTTP triggered function that uses ASP.NET Core’s Health Checking capabilities. In this health check we’re checking to make sure we can access the storage account and that the subscription identifiers that have been configured are valid and are enabled by calling into Azure DevOps. So far we haven’t set up an automatic periodic check of the health, but at least we know that after a deployment things are still working.
Monitoring
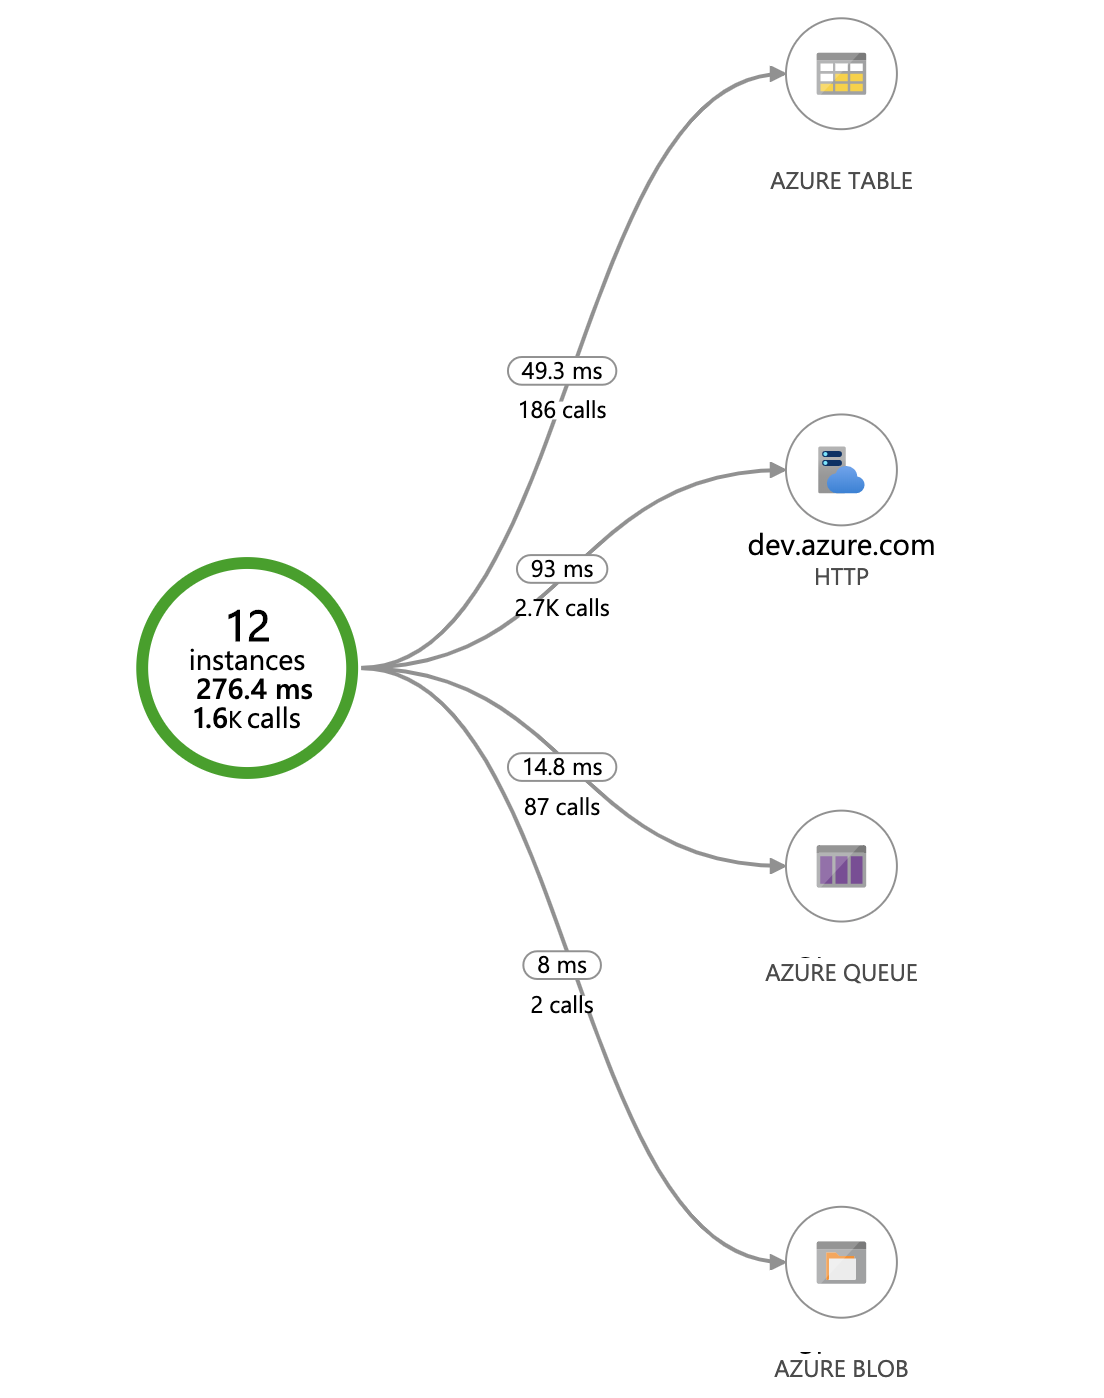
As always just building something and putting it into production isn’t enough. You’ll need to monitor it to make sure things are working correctly, even if it’s just a relatively simple application. Since Azure Functions integrates nicely with Application Insights it made sense to use that. It comes with a whole lot of functionality right out of the box, without having to write any code. For example, we can have a look at how our bot interacts with other services quickly through the Application Map:

AppInsights Application Map
From this we can immediately see how many calls we are making to each service, for example Azure DevOps, as well as the average response time. If calls to those services are failing they will show up in red as well. This can be useful to look at when the bot isn’t working as expected to quickly see where things are going wrong.
In addition to that, due to the integration with Azure Functions, we also get some functions related metrics into our application insights resource. Remember that I mentioned in my previous post that we’ve made each analyzer its own activity function. This means that we can see each individual invocation of that analyzer and see if it is working or failing right from the Azure Function App. For example in the screenshot below we can see that this particular analyzer has been run successfully 1768 times in the past 30 days, but failed 10 times:

AppInsights Function Monitoring
This gives us some really nice insights into how each individual analyzer is performing. And to make it even more useful we’ve included some custom metrics into the bot itself as well. I mentioned in a previous post that we are authorizing request to the bot using the subscription identifiers from the service hook created in Azure DevOps. If that authorization fails that’s an important event, because that could mean that someone is trying to abuse our bot. So we added a little bit of code to the bot to track that as a metric. We’ve defined the metrics we want to track in a CustomEvents class, along with a factory method to create a EventTelemtry instance:
internal static class CustomEvents
{
    internal static class InvalidSubscriptionId
    {
        private const string Name = "PRBot.InvalidSubscriptionId";
        private const string Scope = "Scope";
        private const string SubscriptionId = "SubscriptionId";

        public static EventTelemetry Create(string scope, string subscriptionId)
        {
            var evt = new EventTelemetry(Name);
            evt.Properties.Add(Scope, scope);
            evt.Properties.Add(SubscriptionId, subscriptionId);
            return evt;
        }
    }
}
We then use that factory method in one of the HTTP triggered functions like this:
_telemetryClient.TrackEvent(CustomEvents.InvalidSubscriptionId.Create(nameof(BuildCompleted), payload.SubscriptionId));
The TelemetryClient instance that we need to track this event is injected through Azure Function’s dependency injection mechanism, which is already hooked up the application insights resource that’s associated with the Function App. With this in place we were able to build a dashboard in the Azure portal that uses this metric as well as various other metrics to give an overview of the overall health of the bot. Pretty neat!
Managing the state
There’s one more thing we need to worry about in terms of operations which is cleaning up after ourselves. For each pull request that gets created in Azure DevOps an instance of the durable orchestration is created that captures the state of each analyzer. Once a pull request is completed that state is no longer relevant and can be deleted. Rather than having to do this manually, we’ve automated this bit as well by using a Timer triggered function. This function runs once a day and does pretty much this:
public async Task DailyCleanup([TimerTrigger(SCHEDULE)]TimerInfo timer,
                                [OrchestrationClient] DurableOrchestrationClientBase client,
                                ILogger logger)
{
    var instances = await client.GetStatusAsync();
    foreach (var instance in instances)
    {
        // If the instance has completed, let's remove it
        if (instance.RuntimeStatus == OrchestrationRuntimeStatus.Completed)
        {
            await client.PurgeInstanceHistoryAsync(instance.InstanceId);
        }
    }
}
Note that SCHEDULE is a constant that uses Cron syntax to define how often it runs. For our release builds we put in
0 0 0 * * *which means run this once a day. To help with debugging we’ve used an #if and put in0 */1 * * * *which means run this every minute.
One problem we faced was how we would deal with abandoned pull requests because they could be reactivated at any time in the future. But if they would never be reactivated we would keep state around for no reason. Since there’s a small cost involved, we needed some way to determine if it was still useful to keep that state around. To deal with this, we used a feature of Durable Functions called custom status. What that means is that we write a custom status object from within the durable orchestration at the start of it:
AnalysisContext analysisContext = context.GetInput<AnalysisContext>();
context.SetCustomStatus(analysisContext.PullRequest);
This allows us to read some details about the pull request from our cleanup function to do some additional checks:
else
{
    var customStatus = instance.CustomStatus;
    if (customStatus == null || customStatus.Type == JTokenType.Null)
    {
        await client.PurgeInstanceHistoryAsync(instance.InstanceId);
    }
    else
    {
        var pullRequest = customStatus.ToObject<PullRequest>();
        if (pullRequest.CurrentState == "abandoned")
        {
            bool result = await _gitClientService.DoesBranchExist(pullRequest.ProjectId, pullRequest.RepositoryId, pullRequest.SourceRefName);
            if (!result)
            {
                await client.PurgeInstanceHistoryAsync(instance.InstanceId);
            }
            else
            {
                // Log something
            }
        }
        else
        {
            bool? result = await _gitClientService.IsPullRequestCompleted(pullRequest.ProjectId, pullRequest.RepositoryId, instance.InstanceId);
            if (!result.HasValue || result.Value)
            {
                await client.PurgeInstanceHistoryAsync(instance.InstanceId);
            }
            else
            {
                // Log something
            }
        }
    }
}
Wow, that was a lot, so let me explain what’s happening here. If the orchestration hasn’t completed yet and we know that the pull request is in abandoned state we check if the associated source branch still exists. If it doesn’t, we assume that the pull request isn’t relevant anymore so we go ahead and delete the orchestration. Otherwise we will keep the state around since the pull request could still be reactivated.
One other case we found is that things are going very fast and the pull request has already been completed while the bot was still running. To handle that scenario we also check if the pull request hasn’t been completed in the mean time and clean up the state in that scenario as well. All this ensures that we don’t keep state around that we don’t need anymore.
Conclusion
As you’ve seen we’ve put quite a few things in place to make sure that the bot is running smoothly and can be easily updated and expanded as we move along. Of course there’s always more you can do, but I’m quite happy with how its running now. A couple of my co-workers have already made some pull requests to include additional functionality as we needed it which is nice to see.
One thing I’ve been looking into is to see if it is worthwhile to make use of Durable Entities, which is a new concept in Azure Durable Functions. I think it could make some things a little bit cleaner and easier to maintain, but I haven’t looked at it enough yet to make that choice. Maybe one day.
And with that I’ve come to the end of this series on building a pull request bot using Azure (Durable) Functions. I hope you’ve enjoyed reading this. If you have any questions, do not hesitate to leave a comment here or tweet me on Twitter.