Creating a VSTS dashboard widget
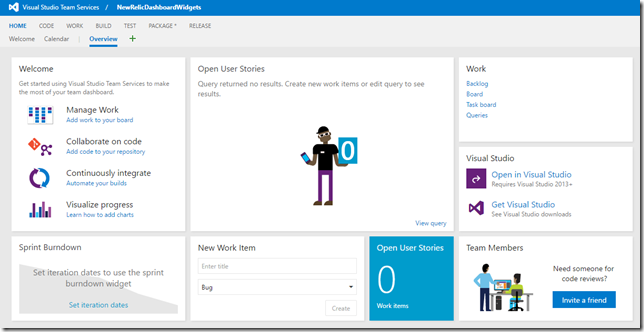
- 9 minutes read - 1911 wordsOn the 30th of October last year Microsoft deployed an update for Visual Studio Team Services (still named Visual Studio Online at the time) which introduced a new start page that could be completely customized. The feature was named dashboards and when I first saw it I realized its potential for putting all kinds of information relevant to a development team right at their fingertips. For those who haven’t seen it yet, this is what the out of the box dashboard looks like:
As can be seen above a dashboard is a grid like system on which various widgets can be placed. When the feature initially shipped the set of widgets that were available was fairly limited and at the the time there wasn’t way to extend them. Fortunately that changed earlier this year when a preview for the Widget SDK was released. Using this SDK we can create our very own widgets and do all kinds of things. All we need is an idea to build one.
Motivation
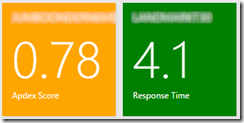
At a customer I’ve been working at for a while now we’ve been using New Relic to monitor the performance of our applications and servers. If you don’t know New Relic I encourage you to take a look because its an awesome tool and it gave us a lot of insights into how our application behaves in production. However, I thought it would be nice if we could integrate some of the data we get from New Relic and put it back into our VSTS dashboards so its readily available for everyone to see. So I set out to do just that. Basically what I wanted is something like this:
Setting up
Dashboard widgets in VSTS are really nothing more than an extension. In fact, VSTS has a fairly extensive extensibility system nowadays that allows you to plug-in to VSTS almost everywhere and extend its capabilities. This works with so called contribution points and a dashboard widget is just another contribution point that you can leverage. To avoid having to create all kinds of files by hand I used a template that’s available on the Visual Studio Gallery that gets you up and running really quickly. Just open Visual Studio, create a new project based on the template and off you go.
Registering a widget(s)
New Relic separates the server and application data so I figured it would be better to separate those in this extension as well. So I’ll create two separate widgets which work more or less in the same way. I started with the server monitoring widget since that was what I needed the most at the time. First thing to do is to open up the vss-extension.json file. This file contains all kinds of metadata about your extension so be sure to set some useful values in there (such as the name, description, tags, links etc.) for your extension. Next, you’ll want to go the contributions section which is where you define what it is your extension contributes to VSTS. This is what it looks like for the server monitoring widget:
"contributions": [
    {
      "id": "ServerStatusWidget",
      "type": "ms.vss-dashboards-web.widget",
      "targets": [
        "ms.vss-dashboards-web.widget-catalog",
        "jonathan-mezach.new-relic-dashboard-widgets.ServerStatusWidget.Configuration"
      ],
      "properties": {
        "name": "Server Status Widget",
        "description": "Displays the New Relic status of a server.",
        "previewImageUrl": "img/server-widget-preview.png",
        "uri": "server-status-widget.html",
        "isNameConfigurable": true,
        "supportedSizes": [
          {
            "rowSpan": 1,
            "columnSpan": 1
          }
        ],
        "supportedScopes": [ "project_team" ]
      }
    }
]
There are quite a few things going on here, so let me break it down. First of all, each contribution must have an id. This is just a name you can use to reference back to it. Next, it needs a type which defines what kind of contribution you’re creating. Obviously, in this case we’re making a dashboard widget, but there are quite a few others to choose from. Have a look at the official documentation to get a sense of the options here. Next up are the targets which is where your contribution is going to show up. In this case we want it to show up in the widget catalog and we also want it to show up in our configuration panel (which I’ll show you later on). Finally there are a bunch of properties you need to set, which are specific to the type of contribution your making. In this case we need a name for the widget (as can be seen in the widget catalog), a description, a URL to a preview image (which can be bundled with your extension), the URL to the HTML page for the widget, whether the name of the widget can be configured by the user and a list of supported sizes for the widget. You’ll also notice the supportedScopes property which can only have the project_team value at the moment (but that might change in the future). Once you’ve configured all these, we can go ahead and actually implement our widget.
Implementing the widget
Basically a widget is nothing more than an HTML page with some JavaScript. You use the HTML page to control the look and feel of the widget and the JavaScript to interact with VSTS and the Widget SDK. For my widget the look and feel is quite straight forward:
<div id="app-status-container" class="status-container">
    <div id="app-health-status" class="health-status">
        <div id="app-name" class="header"></div>
        <div id="app-metric" class="value"></div>
        <div id="metric-name" class="footer"></div>
    </div>
</div>
It boils down to three div’s, one for the header text, one for the numeric value and one for the footer text. Those are wrapped in some containers to give it the nice color you can see in the screenshot above. Note that I’m using some custom CSS classes here to do the styling. In a recent update to the Widget SDK its now possible to use the out of the box styling used by many of the built-in widgets in VSTS which makes it a bit easier to seamlessly integrate into VSTS. I’ll probably do an update to the extension which makes use of that once I’ve finished writing this blog post ;).
Much more interesting though is the JavaScript needed to get everything working. In fact, we need to do two things: initialize the VSTS integration and register our widget with the system. The first step is simple:
VSS.init({
    explicitNotifyLoaded: true,
    usePlatformStyles: true
});
This initializes the VSTS integration and allows us to interact with VSTS through various API’s. The next step is much more interesting:
VSS.require(["TFS/Dashboards/WidgetHelpers"],
  function (WidgetHelpers) {
    VSS.register"ServerStatusWidget", function () {
      return {
        load: function (widgetSettings) {
          // Do something
          return WidgetHelpers.WidgetStatusHelper.Success();
        },
        reload: function (widgetSettings) {
          // Do something
          return WidgetHelpers.WidgetStatusHelper.Success();
        }
      }
    }
    VSS.notifyLoadSucceeded();
});
What happens here is that we ask VSTS to load WidgetHelpers and to call our function when that’s done. When that happens we register our widget with the system using VSS.register(). Note that the name you pass to the register call needs to match the id used in the vss-extension.json file otherwise it won’t work. The second parameter to the register call is an object that needs to have at least a load function. That function is what gets called when a dashboard opens with your widget on it. The reload call is invoked by the system when the configuration of your widget changes (read on to find out about widget configuration). You get passed an object with the settings for your widget and what you do with it is up to you. In my case I wrote some logic to call out to the New Relic API and update the div’s accordingly. The return statement in the code snippet above is important since it is used by the system to determine whether your widget has loaded successfully. Obviously if something went wrong you’ll want to call Failure() instead and provide a reason as to why the widget could not be loaded. Also, make sure you call VSS.notifyLoadSucceeded() so that the system knows that you’re all done. That is really all you need to get a very simple widget going that requires no configuration. Obviously in my case I wanted to provide the user with a little more flexibility so I introduced configuration for my widgets.
Widget configuration
In order to allow a widget to be configured by the user we need to add another contribution:
{
  "id&": "ServerStatusWidget.Configuration",
  "type": "ms.vss-dashboards-web.widget-configuration",
  "targets": [ "ms.vss-dashboards-web.widget-configuration" ],
  "properties": {
    "name":"ServerStatusWidget Configuration",
    "description": "Configures ServerStatusWidget",
    "uri": "server-status-widget-configuration.html"
  }
}
This one is much simpler than the widget itself. Basically we need to tell the extension system what the ID of the contribution is (line 2) and the URL to the HTML page that hosts the actual configuration (line 8). You’ll also need to provide a name and description but as far as I can tell those don’t show up anywhere. Once you’ve added the contribution you’ll want to add an HTML page that will contain the implementation of your configuration page. As with the widget itself, the configuration page also consists of some HTML to do the look and feel and a bit of JavaScript to tie it together. As for the look and feel I just put in a div and a couple of fieldsets for the various parameters I want the user to be able to configure. Unfortunately its a bit hard to match the look and feel of VSTS itself when it comes to configuration pages but hopefully that will improve in the future. To actually implement the configuration page you’ll need to write some JavaScript again. At first glance it looks almost the same as the widget itself, you first call VSS.init() and then VSS.require() and when the WidgetHelpers have been loaded you call VSS.register(). This time though you’ll need to implement a load function (as with the widget) and an onSave function like this:
VSS.require("TFS/Dashboards/WidgetHelpers", function (WidgetHelpers) {
  VSS.register("ServerStatusWidget.Configuration", function () {
    return {
      load: function (widgetSettings, widgetConfigurationContext) {
        return WidgetHelpers.WidgetStatusHelper.Success();
      },
      onSave: function () {
        var customSettings = {
          data: JSON.stringify({
            <customField>: someValue,
          })
        };
        return WidgetHelpers.WidgetConfigurationSave.Valid(customSettings);
      }
    }
  });
  VSS.notifyLoadSucceeded();
});
The load function works the same as with the widget and you use it to set up the configuration page with the values you currently have configured (stored in the widgetSettings parameter). In the onSave method you need to save the settings that are currently set so that your widget can access them. The easiest way to do this is is to construct an object with the configuration values and serialize that with JSON as shown above. The resulting string can then be passed to the system so that it can be stored and passed on to the widget. With that setup you should be able to configure the widget with whatever configuration parameters you think are needed for the widget.
Conclusion
As you’ve seen its really easy to build a custom dashboard widget using just a bit of HTML and JavaScript. Its this simplicity that also makes it very powerful and I’m curious to see what people come up with. I haven’t yet shown how you can test and debug your widget (or an extension for that matter) but I’ll leave that for another post. In the mean time be sure to check out the New Relic Dashboard Widgets extension and try it out for yourself. Or if you’re curious to see how it works check out the code for it on GitHub. Also check out the official documentation on how to create extensions for VSTS and TFS (although it seems that dashboard extensions aren’t yet supported in TFS on-premise).

